2013年10月12日 星期六

[AOSP] ninja build system design

Build system performs 3 main tasks
  1. load and analyze build goals
  2. figure out what steps need to run
  3. execute those steps

Optimization

Use GYP save intermediate state for ninja to load when it generate ninja build files. It can reduce ninja load time.

Use lookup table to check input character which can reduce parsing time.

In order to represent file dependency of nodes and graph which make checking  Canonicalize file path and map the name to an internal Node object which can reduce file name comparison.

Use build log to check whether it should rebuild the command since we can see whether different compilation flags.

When compiler compile the file, it knows what header files the file needs. Record the compiler to output dependent header files can reduce "header scanner" time. Of course first time build need to compile all files since there is no record files. (file name should be canonicalize before output)

Alternative design

ninja run as memory-resident daemon which monitor file modification and avoid load/write data time between build.

Reference
http://aosabook.org/en/posa/ninja.html


2013年8月28日 星期三

[NOTE] HTTP 2.0

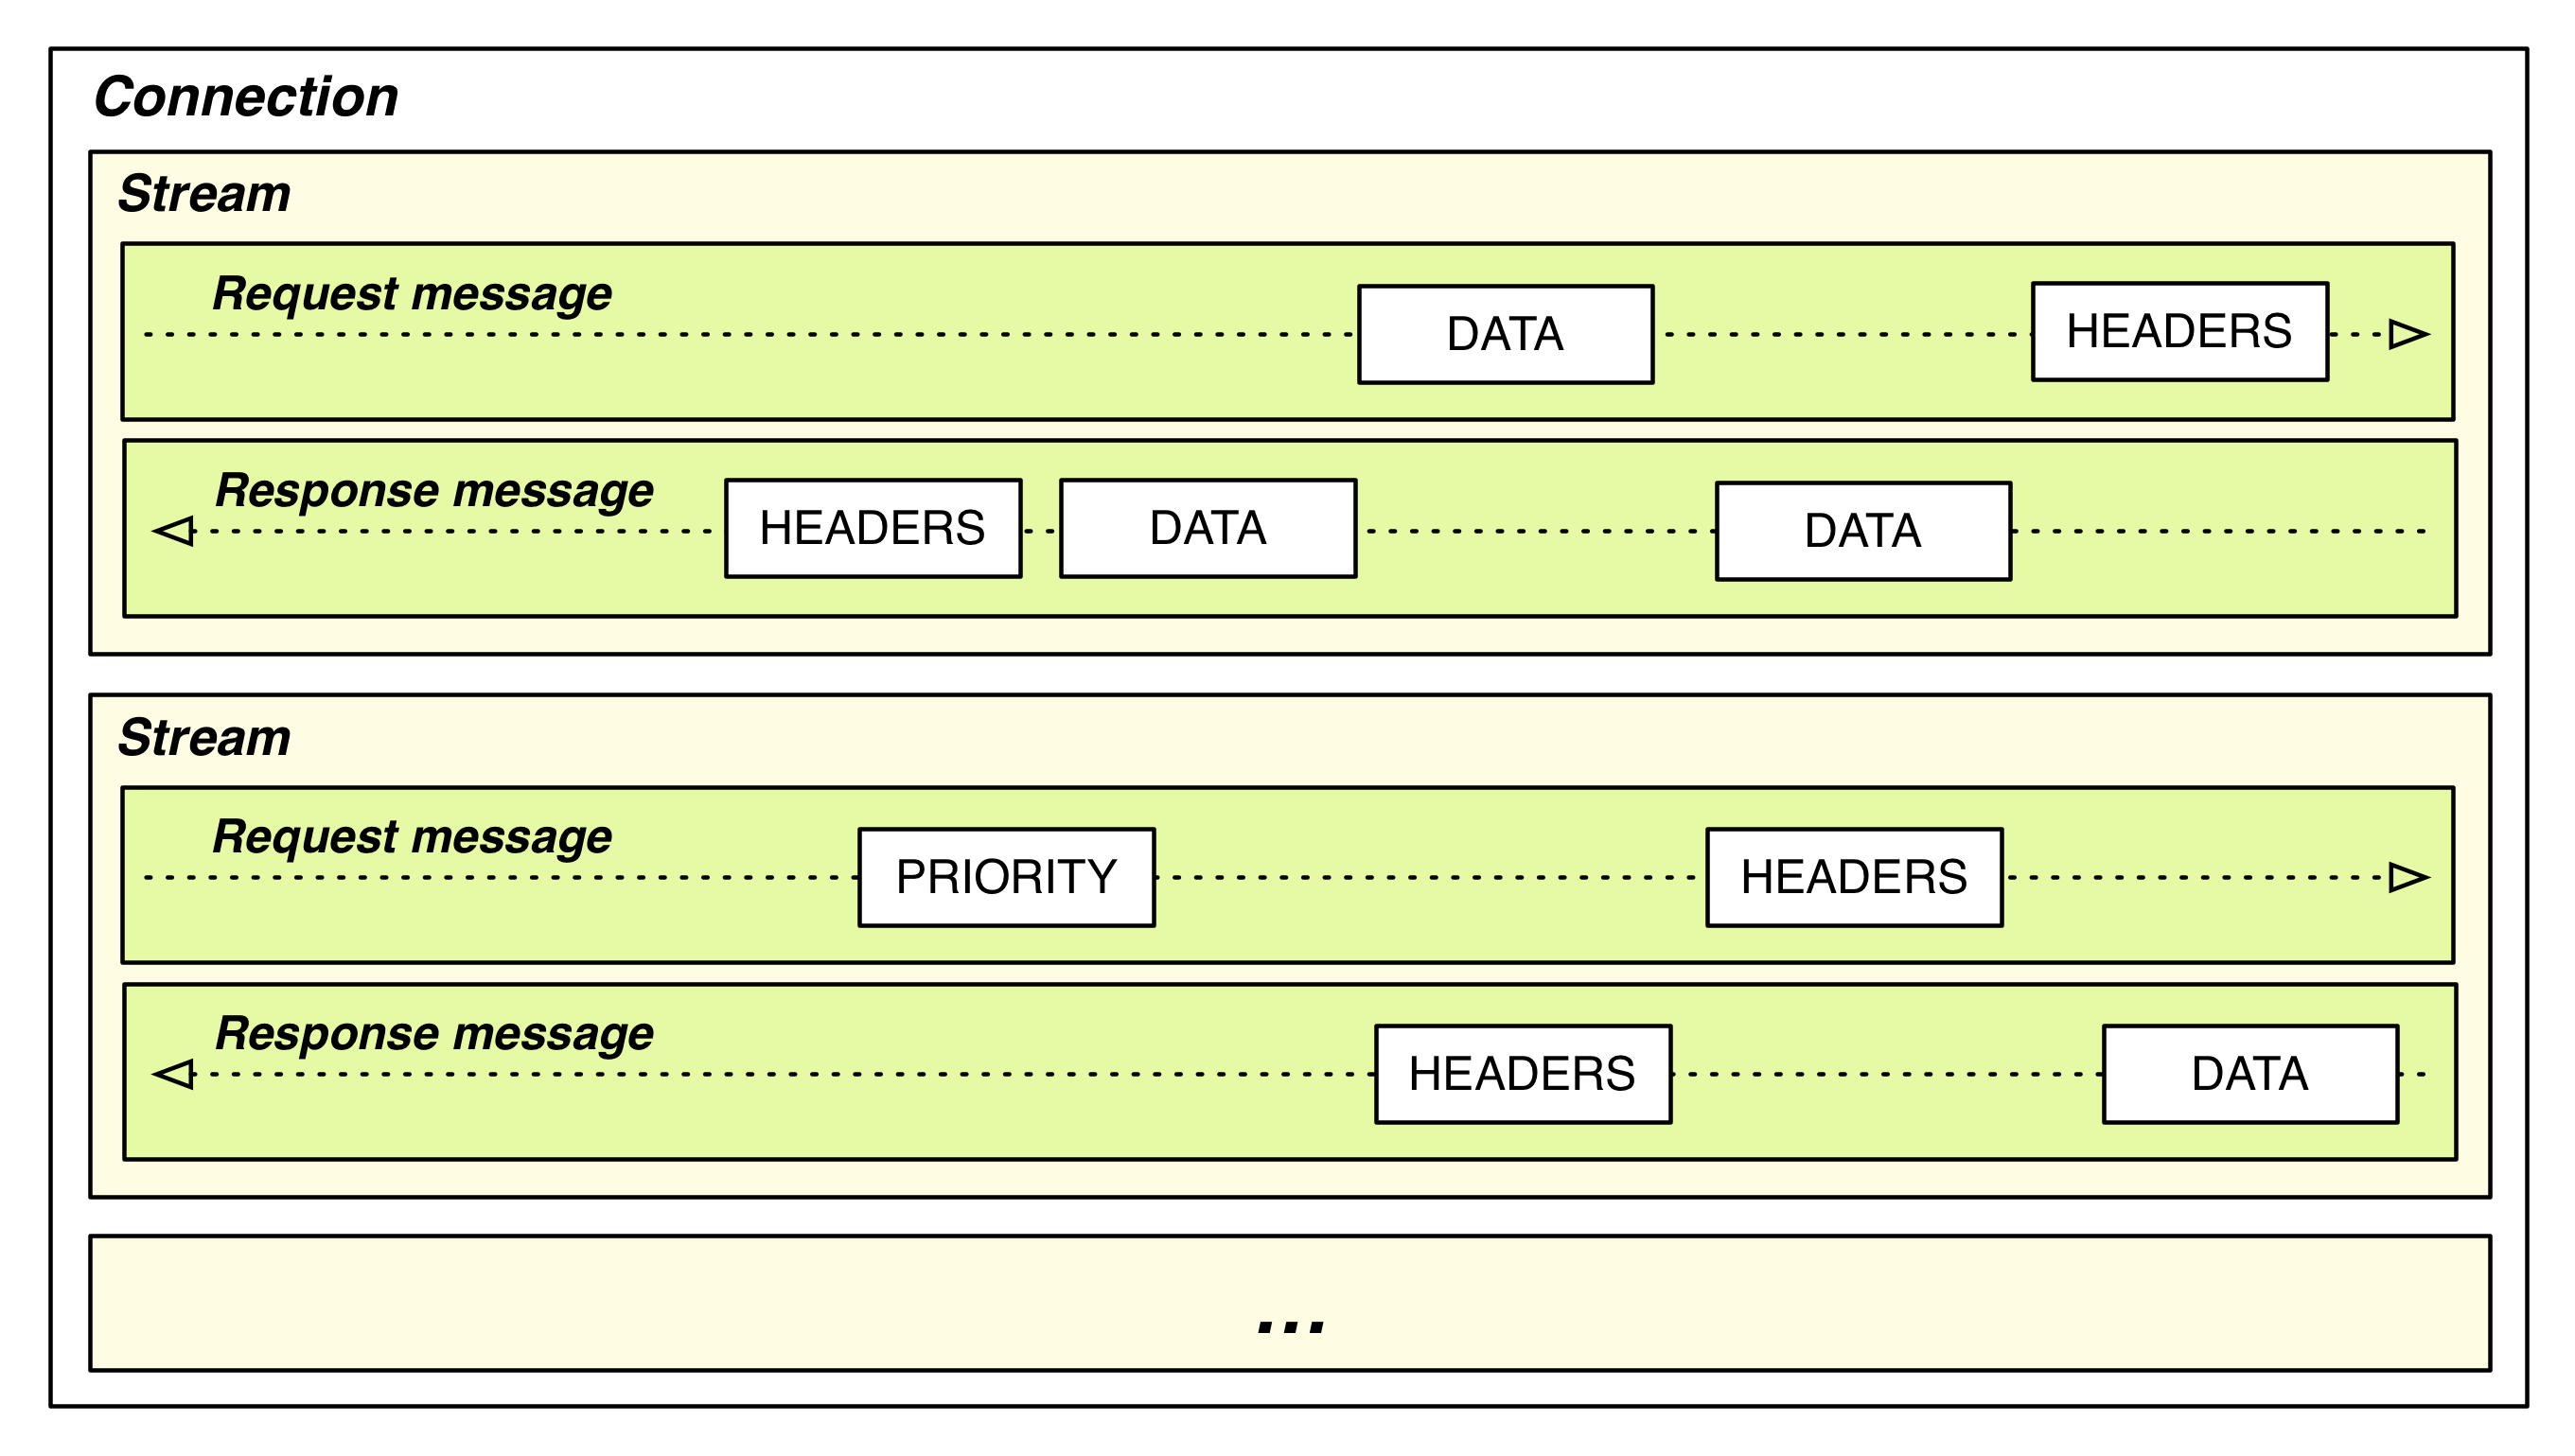
The primary goals for HTTP 2.0 are to reduce latency by enabling full request and response multiplexing, minimize protocol overhead via efficient compression of HTTP header fields, and add support for request prioritization and server push.


  • Request/Response multiplexing
    • Each session can have many streams, each stream can transfer many messages in both direction. Each message is contained by many frames. Frame is the base unit.
    • one connection per origin
      • avoid "Slow-Start" on TCP
      • better header compression
        • keep track key-value header table on server/client side

    •  
  • Server push
    • server can create stream to client as well
  • Header compression
    • header tables with key/value and maintain on server/client side
    •  so no need to send the same header if it match previous request
  • Flow control on each stream
Reference:
High Performance Browser Networking CH12

2013年8月12日 星期一

[Note] Why mobile web app are slow

Why mobile web apps are slow

這篇文章提到一些值得後續繼續觀察的地方, 記錄一下

  • JS 本身大概比 C/C++慢五倍
  • ARM 比x86 慢10倍, 所以在arm上面的mobile device上面跑js, 會比desktop上面還要慢50倍
  • 過去幾年JS的效率其實沒有多大提升, 主要可能都是硬體上效能的增進
  • GC (garbage collection) 對於效率上破壞很大, 尤其在記憶體限制的環境下, 下降的幅度可能是指數
  • iOS 上面, 單純的一張image都有可能會buffer多份
  • ARM架構上面使用POP (package on package), 這部分會影響ARM之後能夠使用更大的記憶體, 可能更困難 (相對於x86)
  • asm.js 或許是個解決方式, 但是或許chrome上面的NaCL,也是另一個方式, 畢竟asm.js 已經不算是寫js了
 不過mobile上面最佔資源的可能還試圖片或是影片, 這些部分的處理就算都用native code, 還是會因為記憶體上的限制, 所以我覺得如果ARM 架構, 能夠支援夠多的記憶體, 那JS慢也就比較無關緊要

[Font] Study note

建議把 FreeType tutorial 上面的文章看完,

下面的圖是從tutorial擷取, 在設定一些字形相關設定,可以了解關於字型的metrics:


除了glyph 本身的bitmap,有時某些字跟前文也有關係,像是當A後面接U的時候, 它們可以減少字距 (kerning), 所以glyph有些也會另外帶kerning tabl,來記錄前後文該有的間距

2013年6月25日 星期二

[Memory] heap profiling

當我們要找 memory usage 的話, 可以使用 Valgrind (Massif), 不過 valgrind有個很大的缺點, 就是他會讓你的程式慢個10倍以上...
今天發現 tcmalloc 也可以使用 heap profiler, 而且使用上也很簡單. 重點是 他沒有valgrind那麼慢!!

在 Ubuntu 12.04 上面, 按照下面步驟~
$ sudo apt-get install google-perftools
# link your program with "-ltcmalloc"
$ HEAPPROFILE=/tmp/profile.log ./program

另外他也提供可以讓你隨時產生 memory dump 的方式, 使用 HeapProfilerStart() and HeapProfilerStop() 來指定你甚麼時候要開始進行 heap profiling, HeapProfilerDump 則可以在你想要dump memory report的dump.

Note:
記得不要傻傻直接去裝 libtcmalloc-minimal0 這個套件, 這個套件沒有把 heap profiler 放進去, 我是在使用上述HeapProfiler function的時候 發現找不到symbol才發現有少裝套件...

查看report
當你跑完廁試之後, 接下來就是要讀懂產生出來的report, 在ubuntu 12.04 你需要安裝 google-perftools, 安裝完後, 會有 google-pprof 這個指令可以用
# 這個指令可以產生gv觀看的圖檔
$ google-pprof --gv program profile.log
# 或是 你只想看text
$ google-pprof program profile.log
Using local file program.
Using local file profile.log.0003.heap.
Welcome to pprof!  For help, type 'help'.
(pprof) top
Total: 21.3 MB
     8.6  40.5%  40.5%      8.6  40.5% Foo1
     7.2  33.7%  74.2%      7.2  33.9% Goo1 (inline)
     2.0   9.4%  83.6%      2.0   9.4% 00007f9f7c292daf
     0.8   3.7%  87.3%      0.8   3.7% 00007f9f7751424c
     0.4   1.8%  89.1%      0.7   3.2% Filter_32_alpha_portable (inline)
     0.3   1.4%  90.5%      0.3   1.4% 00007f9f806d3480
     0.2   1.0%  91.5%      0.6   2.6% ZZZ (inline)
     0.2   0.8%  92.3%      0.2   0.8% 00007f9f7f86b0ca
     0.2   0.8%  93.1%      0.2   0.8% 00007f9f718c673f
     0.1   0.7%  93.7%      0.1   0.7% 00007f9f7ecdb79d
     0.1   0.5%  94.3%      8.7  41.0% OOO
(pprof)

2013年6月14日 星期五

[Shared Memory] passing fd across processes

Posix shared memory 允許使用類似file descriptor的方式來操作, 當使用shm_open取出 FD 之後, 後面你可以使用傳統 file descriptor 相關的 system call, ex: ftruncate, fstat.

chromium 裡面也有提供shared memory的wrapper, 但是看到下面的code, 覺得怎麼可能這麼簡單, duplicate FD, 然後 IPC 送出去, 其他 process 就可以使用?!
bool SharedMemory::ShareToProcessCommon(ProcessHandle process,
                                        SharedMemoryHandle *new_handle,
                                        bool close_self) {
  const int new_fd = dup(mapped_file_);
  if (new_fd < 0) {
    DPLOG(ERROR) << "dup() failed.";
    return false;
  }

  new_handle->fd = new_fd;
  new_handle->auto_close = true;

  if (close_self)
    Close();

  return true;
}


仔細 trace 了一下 code, 果然有些細節在裡面, 發現 chromium IPC 是用 socketpair, 這會create 一對 connected UNIX domain sockets 來做IPC, 但是在 serialize 的過程中還有一些 trick 要做, 不過細節上大概就跟 這邊這裡 (control message on UNIX domain socket) 提的一樣. chromium 是實做在 Channel::ChannelImpl::ProcessOutgoingMessages 跟 Channel::ChannelImpl::ExtractFileDescriptorsFromMsghdr 這邊. 基本上還是要讓 kernel 了解到 FD 實際對應到的 Open file table (參考TLPI ch5.4) 在不同 process 是一樣的.
所以 receiver process 拿到 FD 跟 memory size之後, 就可以使用 mmap, 來讀取memory~